DataPulse Analytics SaaS
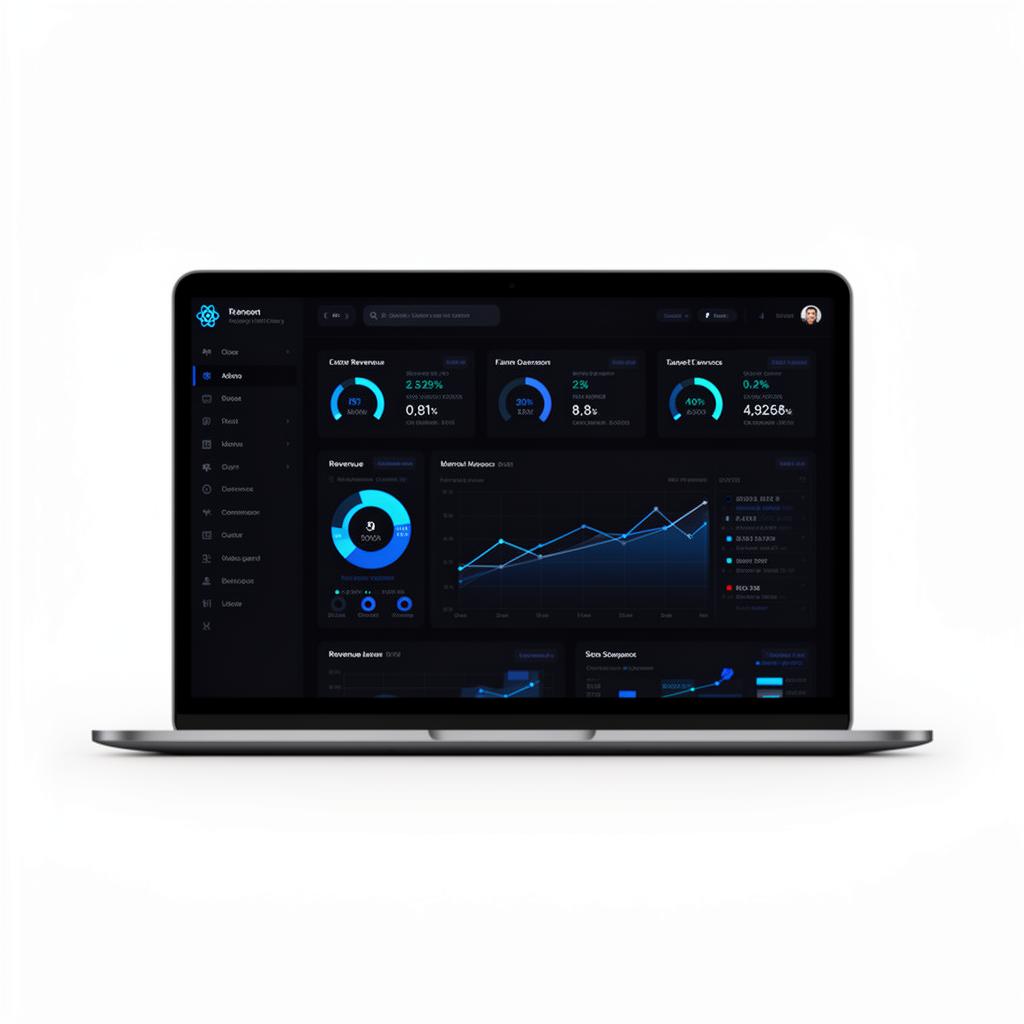
Real-time analytics dashboard with interactive charts, role-based reporting and AI-powered insights for e-commerce operators.
- Industry
- E-commerce analytics SaaS
- Duration
- 9 months
- My role
- Fullstack architect
- Client
- DataPulse Analytics
Challenge
An analytics SaaS for e-commerce operators was choking on Postgres aggregations — dashboards took 30+ seconds to render at 1B+ events/month. The product team also wanted AI-powered insights (anomaly detection, forecasts) without rebuilding the stack.
Solution
Migrated the analytics warehouse to ClickHouse for sub-second OLAP queries, rewrote the dashboard on Next.js 14 App Router with React Server Components for instant first paint, added tRPC for end-to-end type safety, and wired an OpenAI-backed insights pipeline that flags anomalies and writes plain-language summaries.
Technology stack
Result
Dashboard TTI dropped from 30s to under 400ms, the platform now ingests 1.2B events/month on the same infra, and AI summaries became the #1 retention feature in customer interviews.
Key metrics
- 1.2B
- events/month
- < 400ms
- dashboard TTI
- AI
- anomaly detection
Dashboard TTI from 30s to under 400ms. AI summaries became the #1 retention feature in customer interviews.